Depreciation in the used car market is one way to read demand for a manufacturer’s vehicles. Vehicles that are more in demand depreciate less. To compare the depreciation of the Tesla Model S with competing in class vehicles, we collected data on used cars and constructed an ordinary least squares (OLS) regression model. Here are the takeaways:
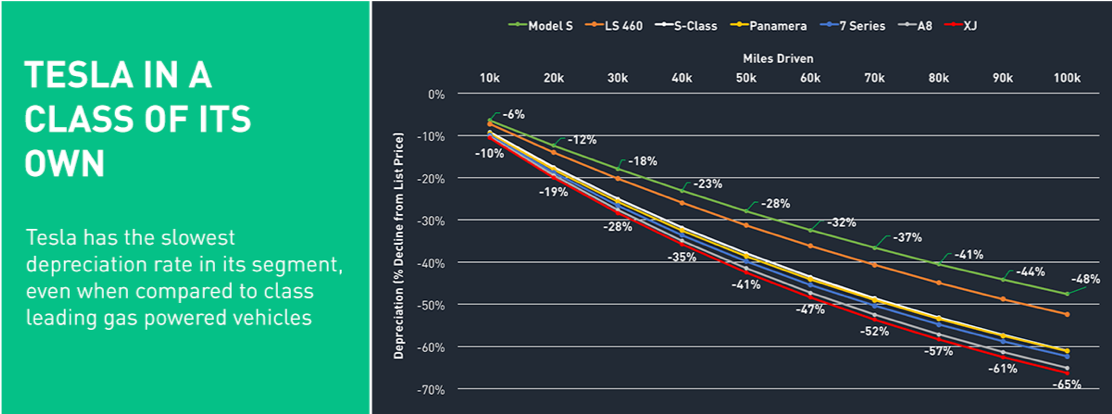
- After 50k miles, a Tesla Model S will have depreciated 28% vs the in-class competitor average of 38%.
- A Tesla Model S holds 7% more value than its competitors regardless of variables like model year, miles driven, and initial sale price.
- In a stable economy, the used car market is a proxy for new car sales. This study is a sign that Tesla continues to gain share vs. comparable in-class vehicles.
Below we provide our auto depreciation case study in full.
Objective: Find if the Tesla Model S depreciates more, less, or the same as in-class competitors.
Background
We started by looking at an Autolist survey which concluded Tesla holds value better than its competition. Their data points showed:
Depreciation after 50k miles (% value lost)
- Tesla Model S: 28%
- Lexus LS 460: ~ 32%
- Mercedes S-class: ~ 36%
- Porsche Panamera: ~ 37%
- BMW 7 Series: 40%
- Audi A8: 40+%
- Jaguar XJ: 41%
Tesla holds value better than other EVS (Volt, i3, LEAF). Those 3 electric vehicles depreciate more than other cars of their same class. Tesla is in a higher price bracket and different class of car. This probably doesn’t have a significant impact, because usually higher priced cars have worse depreciation.
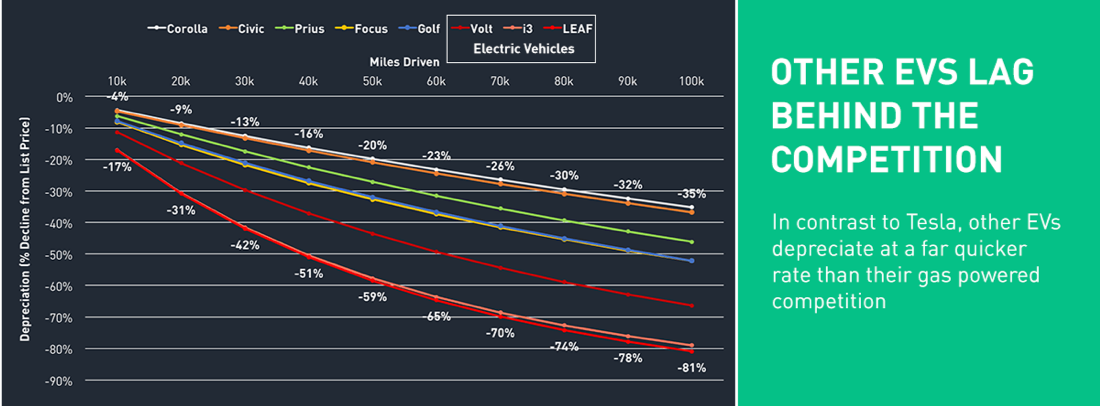
Information from Autolist survey: Results compiled from comparing depreciation of vehicles. The study looked at 1.6 million data points from January 1, 2012, to August 31, 2016.
Based on a quick skim of current listings these numbers seemed optimistic. For a few years, it would make sense that Teslas held value better because of their low supply and this could have biased their data. We decided to conduct our own survey based on today’s prices.
Research
Data Collection
We used the same models in the Autolist survey and scraped listings of used cars from the manufacturer’s websites. All cars were from the manufactures equivalent of Certified Pre-Owned. We then calculated the MSRP of each car by adding the price of all options listed to the base price of that model (eg. 2015 Tesla Model S P85D). There is a possibility for error in this step1
- Manufacturers / Models:
- Lexus LS 460
- BMW 7-series
- Jaguar XJ
- Porsche Panamera
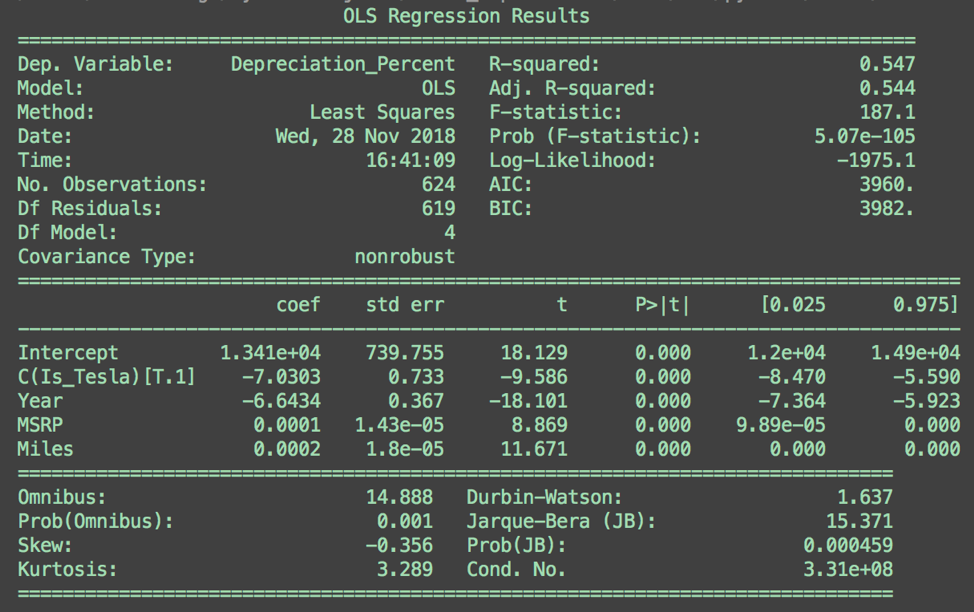
We then built a regression model to predict the percent a car has depreciated based on Year, Miles driven, and MSRP. We included a categorical variable Is_Tesla whose coefficient will tell us if there is a difference between Tesla and competitors (assuming both that OLS model and the Is_Tesla variable are significant).
1: Any calculated price could be ~3% short on average. Tesla’s were probably more accurately calculated because they have less complicated options. If the other cars are slightly under-estimated, that would mean they had depreciated slightly more than what we calculated. Over-all, calculations should be sufficiently accurate and there is no significant impact on results.
Part 1: Is Our Model “Good?”
Regression Results
Step 1: Examine R-Squared
We have mediocre accuracy. 54.7% of variation from mean is explained.
Step 2: Check Residual Plots
We should check residual plots to make sure we are not over-fitting and to see if any patterns suggest we have problems with multicollinearity.
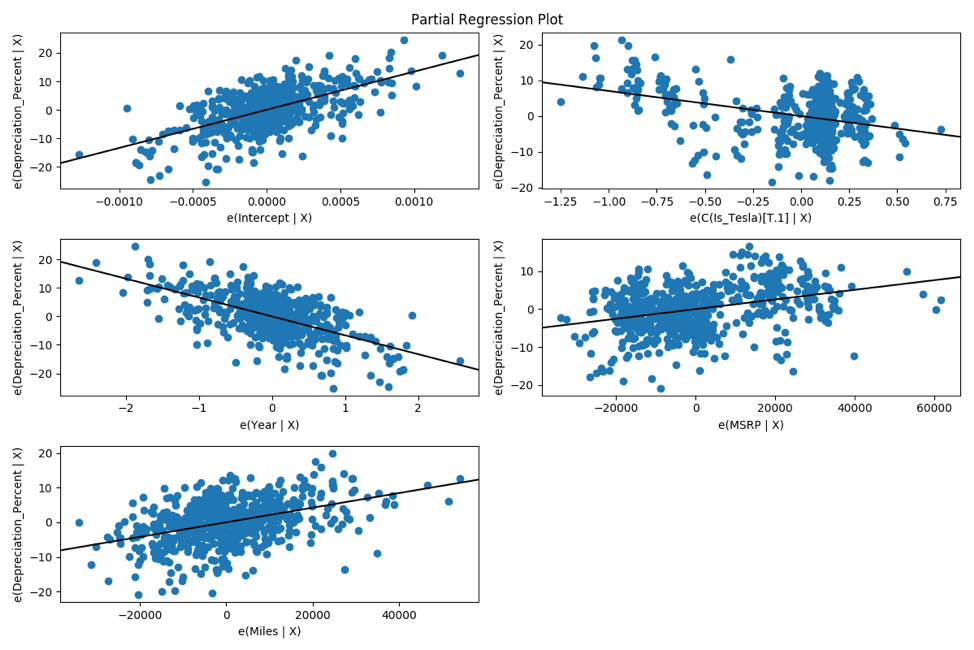
There are no obvious patterns in residual plots and residuals evenly spread -> our predictor variables are not highly correlated and our error is stochastic.
Step 3: F-Test
<F test: F=array([[187.08764401]]), p=5.0684582001206436e-105, df_denom=619, df_num=4>
Our p-value is very small, we can reject the null hypothesis. Our model can explain variability better than the intercept only model (where all coefficients are 0).
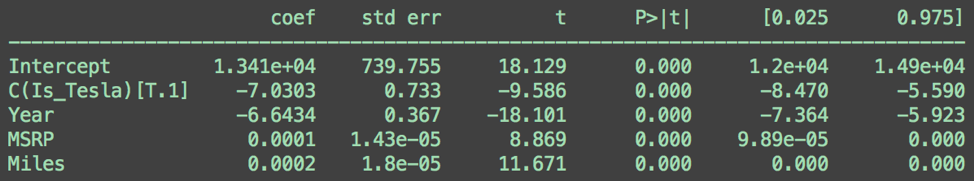
For each of the variables, the p-value (P>|t|) is 0. This indicates that all of our coefficients are significant.2
0 is contained in the 95% confidence intervals for the value of MSRP and Miles coefficients, this could indicate an issue with their significance. With P>|t| = 0, 0 should not be in the 95% confidence interval for the variable. When playing around with variations of this model, R-squared decreased when MSRP and Miles were removed.
2: P>|t| represents the two-tailed p-values with an alpha of 0.05.
Conclusion
We have a useful model. We have chosen features which can be used to predict car depreciation.
Part 2: Tesla vs. Competition
The Is_Tesla variable
We made a categorical variable Is_Tesla. This is a 1 if the used car is a Tesla and 0 if it is not.
- The coefficient is the effect of changing from category 0 (not-Tesla) to 1 (Tesla) -> All else equal, what would be the effect of a competitor magically becoming a Tesla.
- If the Coefficient is…
- >0: The expected Depreciation is higher for group 1 (Tesla’s depreciate more)
- <0: The expected Depreciation is lower for group 1 (Tesla’s depreciate less)
Our coefficient is -7.0303 so, all else equal, Tesla’s depreciate 7% less than competitors -> Tesla’s hold 7% more value than in-class competitors.
Another View: Compare Two Differently Trained Models
As a sanity check: We trained a model on only competitors and a model on only Tesla. The Tesla model predicted less depreciation -> For a change in any coefficient that would increase depreciation, that change increases depreciation more on the Non-Tesla model -> Conclusion: for example, an increase in miles driven increases depreciation more if the car is not a Tesla.
Shortcomings
- We could use more data: We have 88 data points for Non-Tesla and 537 for Tesla. This means our results for Non-Tesla cars are more susceptive to bias from extremes. It is difficult to determine the “Right” amount of data. Given how many different models of car are included in our model, it would be nice to have at least 10-20 data points spread across years and miles for each sub-model of car (sub-model meaning BMW 7 740i, 740ixDrive, 750i, 750ixDrive etc).
- Missing Perfect MSRP: We do not have the exact MSRP of all cars. Porsche provided specs with the exact price. For other manufacturers, we had to calculate them. We may have missed adding in an option here and there.
Disclaimer: We actively write about the themes in which we invest or may invest: virtual reality, augmented reality, artificial intelligence, and robotics. From time to time, we may write about companies that are in our portfolio. As managers of the portfolio, we may earn carried interest, management fees or other compensation from such portfolio. Content on this site including opinions on specific themes in technology, market estimates, and estimates and commentary regarding publicly traded or private companies is not intended for use in making any investment decisions and provided solely for informational purposes. We hold no obligation to update any of our projections and the content on this site should not be relied upon. We express no warranties about any estimates or opinions we make.