Apple’s ability to promote its own services like Apple Music, iCloud, and Apple Pay represents a meaningful competitive advantage. We looked at the three major music streaming services (Spotify, Apple Music, and Pandora) to quantify how iOS ownership impacts paid subscribers and market share.
- In July, Tim Cook reported that Apple Music became the market leader in terms of paid subs in North America and Japan. We estimate Apple Music has 21m North American subs vs. Spotify at 20m.
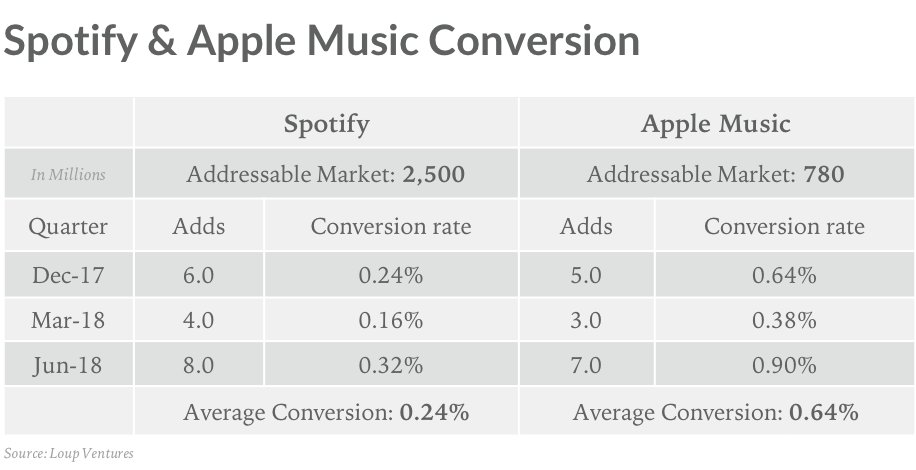
- Adjusting for addressable market (we estimate that 95%+ of Apple Music subscribers are on iOS), Apple is converting potential customers into paying customers at a rate 2.5x faster than Spotify.
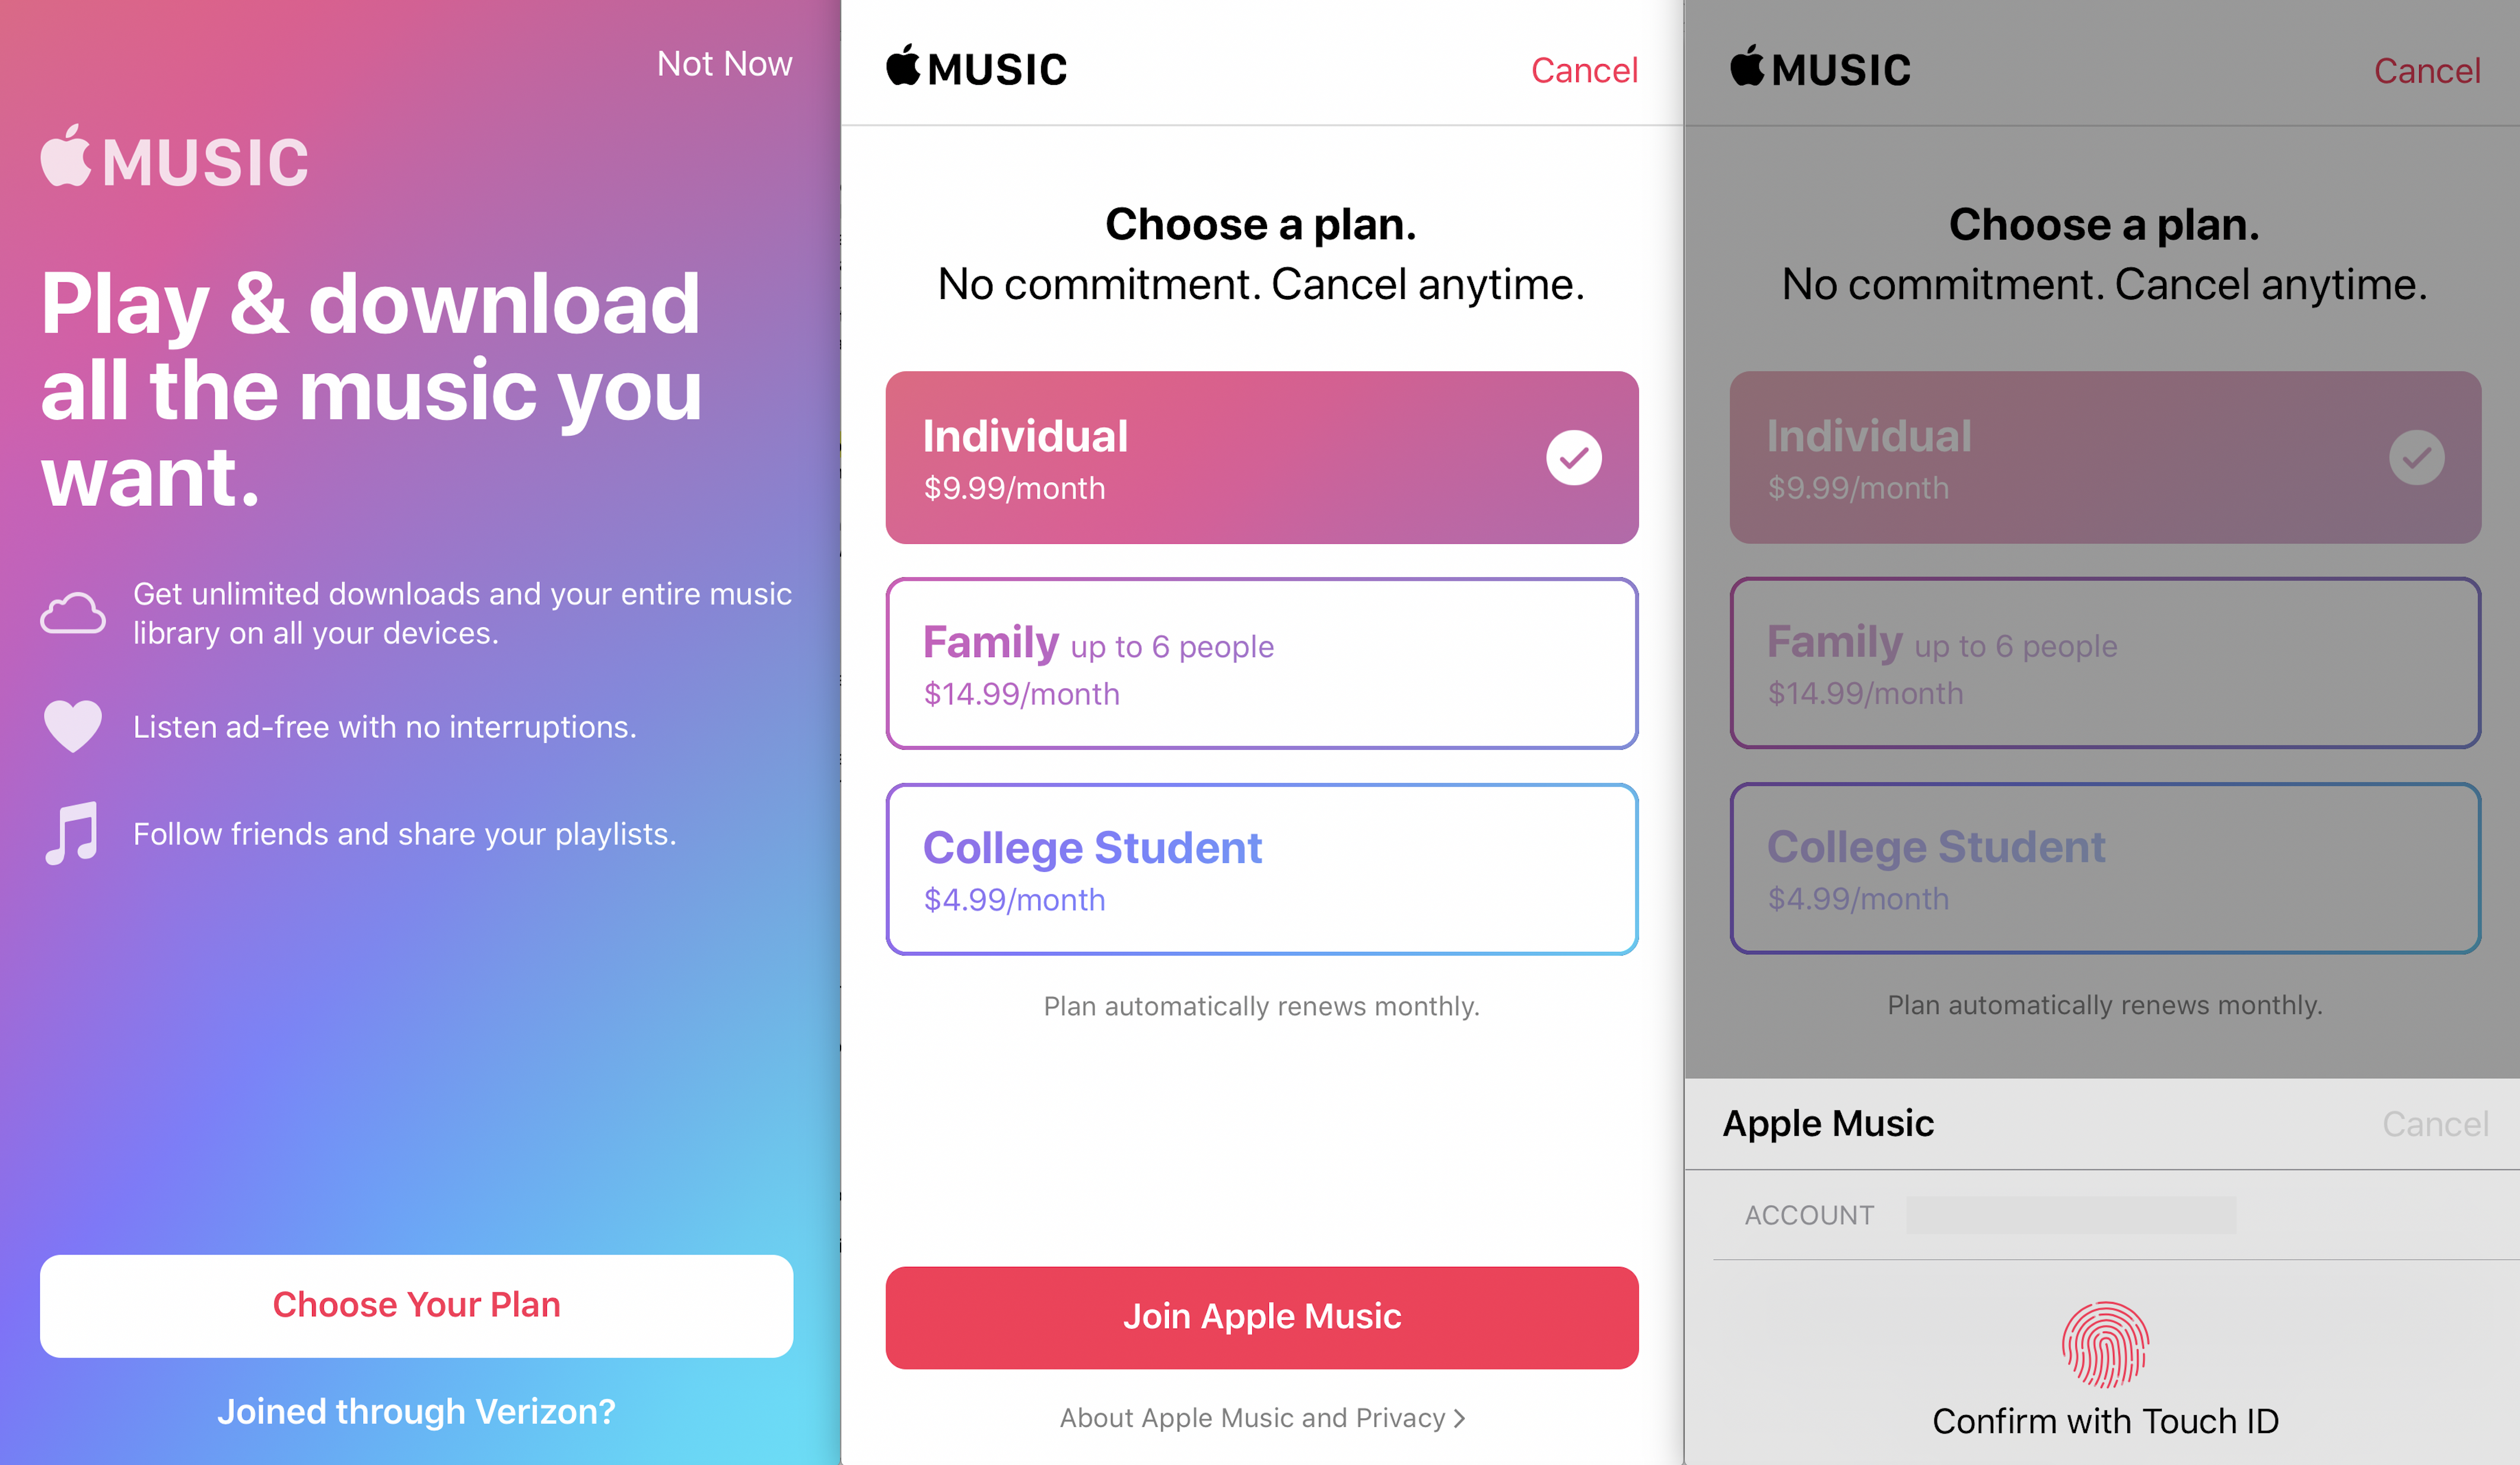
- Apple’s higher conversion rate can be attributed in part to iPhone owners having more disposable income compared to Android owners. A second, more material contributor is Apple’s ownership of iOS which distributes a seamlessly integrated music experience along with prompts to get iPhone owners to subscribe.
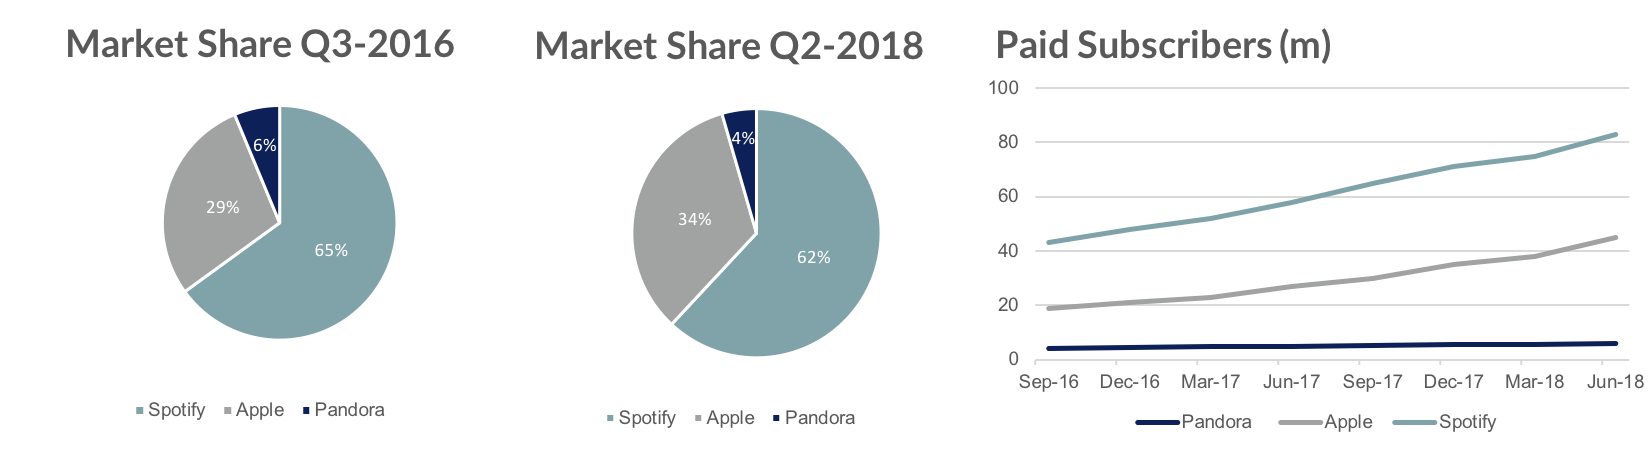
- Spotify still controls the global paying music streaming market with about 62% share, down slightly from 65% in Sep-17. Apple has grown to 34% from 30% in Sep-17. Pandora has lost share from 6% to 4%.
- Apple Music has room to grow with just 45m subs out of 780m active iPhone users (6%) paying for the service.
iOS Ownership Drives Market Share Gains
We looked at paying subscribers for the top three music platforms over the last 8 quarters to get a sense of conversion rates and market share trends. Spotify leads by a wide margin in global paid subs with 62% share, but Apple has gained 4% share in the last three quarters. Over the past 2 years, Apple Music has grown paid subs by 137% compared to 93% for Spotify and 45% for Pandora.
Apple Music Conversion Quickens, Spotify Stable
We found the average conversion rate for Spotify over the past 3 quarters to be 0.24% compared to 0.64% for Apple Music. This suggests that Apple Music has been 2.5x more effective at converting potential subs into paying customers. While Apple Music is available on Android, we estimate less than 5% of subs are on Android. This conversion has accelerated for Apple during that time. From Dec-16 to Sep-17 Apple Music converted an average of 0.35% vs. 0.64% from Dec-17 to Jun-18. Spotify converted at 0.22% vs. 0.24% from Dec-17 to Jun-18.
Conversion Rate Methodology
Here’s the logic: Spotify has more users, but they also have a lot more shots on goal because the service works well on both iOS and Android. Apple Music, while it is available to Android users, is more or less limited to unique iPhone owners (we estimate there are 780m). To find the conversion rate we divided the quarterly additions to paid subs by the total addressable market (which has been stable throughout this timeframe). While Apple Music is adding fewer users in absolute numbers, relative to their addressable market, they are converting potential users 2.5x more effectively.
This Strategy Applied to Other Services
Owning the OS and the hardware it runs on means Apple services are universally distributed (the Music app is preloaded on all iOS devices) and work seamlessly across devices (pick up where you left off on iPhone, Mac, HomePod). Users are also presented prompts to remind them to subscribe, which is managed through an Apple ID and paid for with Apple Pay. This strategy is a key driver of adoption of Apple services like their forthcoming original video content platform, iCloud, Apple Pay, Apple Music, and others.
Disclaimer: We actively write about the themes in which we invest or may invest: virtual reality, augmented reality, artificial intelligence, and robotics. From time to time, we may write about companies that are in our portfolio. As managers of the portfolio, we may earn carried interest, management fees or other compensation from such portfolio. Content on this site including opinions on specific themes in technology, market estimates, and estimates and commentary regarding publicly traded or private companies is not intended for use in making any investment decisions and provided solely for informational purposes. We hold no obligation to update any of our projections and the content on this site should not be relied upon. We express no warranties about any estimates or opinions we make.